Researchers are currently trying to find out how to use machine learning algorithms for a smart factory.
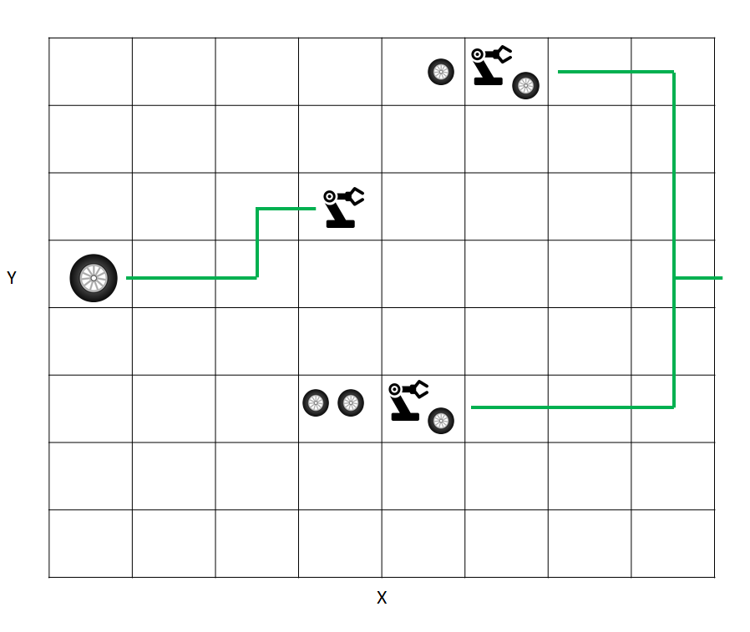
One part of a smart factory is to combine the virtual and the real world in the use case of a manufacturing process. The machines and items that should be produced, are connected and the parts try to find their optimal route through the factory. Where this scenario mostly exists in scientific simulations, it is a good way to identify potential problems before using it in reality. The following graphic shows an 8×8 grid where we are producing tyres. The tyres (items) are moving autonomously on platforms and search their optimal route through the factory.
Technically we are talking about multi-agent systems, that exchange their routing information with their neighbor parts to share the optimal strategy. This strategy could be whether cooperative by optimizing a shared cost function or individual with a self-optimizing cost function. First, this sounds like reinforcement learning, where you try to use rewards, to learn the optimal route. Another interesting solution to solve that problem could be to treat the grid as an image and use Convolutional Neural Networks.
So now when we have our machine learning algorithm ready, a new problem arises. How can we identify potential problems? Congestion? Machine overload? Machine break-downs? At least we do not just want to identify problems, we want to identify the root cause. This process is also called Root Cause Analysis.
The usual solution to do a Root Cause Analysis would be to algorithmically search for the problem. But what if we do not really know after what we are searching? What do output parameters and numbers actually tell us? As humans are more graphically, the solution could be a graphical representation of the simulation. Combining that graphical representation of virtual reality further makes the task of Root Cause Analysis more interesting.
To establish a showcase, I worked on a project for the Root Cause Analysis in Virtual Reality combined with Amazon Alexa for speech recognition to make it feel more natural. The result is the visualization of a smart factory algorithm that allows analyzing the output data more intuitively by choosing simulation time steps, visualizing a heatmap, choosing different perspectives, show item details and item routes. The following video shows how the items are going through the factory, and how the heat map helps to identify congested routes in the algorithm.